Reach for the Star | GCSE Mathematics

L046: Tables charts and time series

Objective

Represent and interpret categorical data, grouped data and time series.

Calculator: Non-calculator core; calculator optional only for checking where labelled.
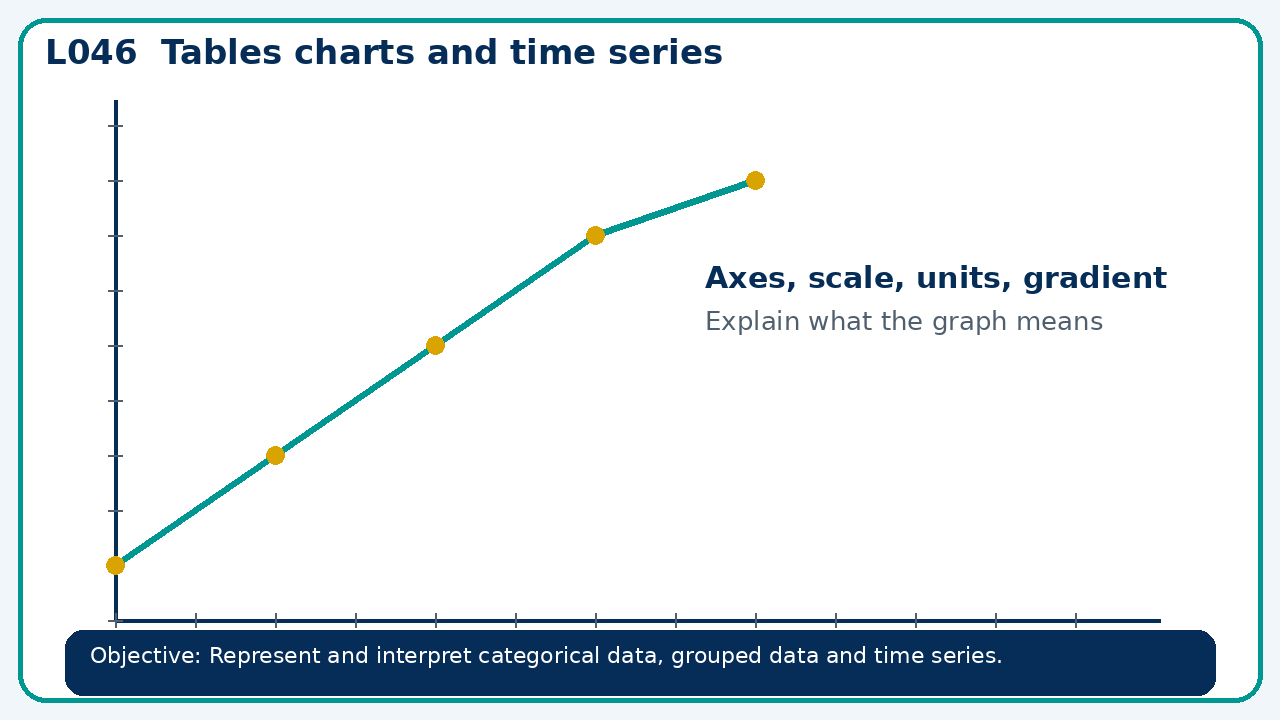
Visual model for Tables charts and time series
Points route: Connect 2 · Share 2 · Apply 6 · Review 3 · Stretch 2 · Deep Challenge 3. Record your score honestly after you have checked your answer.

Recall

Retrieve the key fact or method needed for tables charts and time series.

Core practice

A pie chart represents 72 people. A sector angle is 135°. Find its frequency.

Reasoning

A time-series graph starts its vertical axis at 90 instead of 0. Does this make the data wrong? Explain the risk.

Exam-style

Solve an exam-style problem involving tables charts and time series. Show working, include a check and interpret your answer.

WWW / EBI

Recall & Review: feedback and extension integration

Lesson L046: Tables charts and time series

Objective: Represent and interpret categorical data, grouped data and time series.

60-minute structure: 0-7 Connect & Check; 7-14 Share; 14-25 Present/model; 25-44 Apply route choice/practice; 44-52 independent exam-style check; 52-60 Recall & Review, WWW/EBI and next step.

What Went Well (WWW)

I selected an appropriate statistic or representation and supported my comparison or interpretation with specific evidence from the data.

Even Better If (EBI)

I will quote the relevant values or features, compare like with like and explain what the evidence shows without making an unsupported claim.

Stretch and deep challenge

Stretch: A pie chart represents 72 people. A sector angle is 135°. Find its frequency.

Deep challenge: A time-series graph starts its vertical axis at 90 instead of 0. Does this make the data wrong? Explain the risk.